Project Description
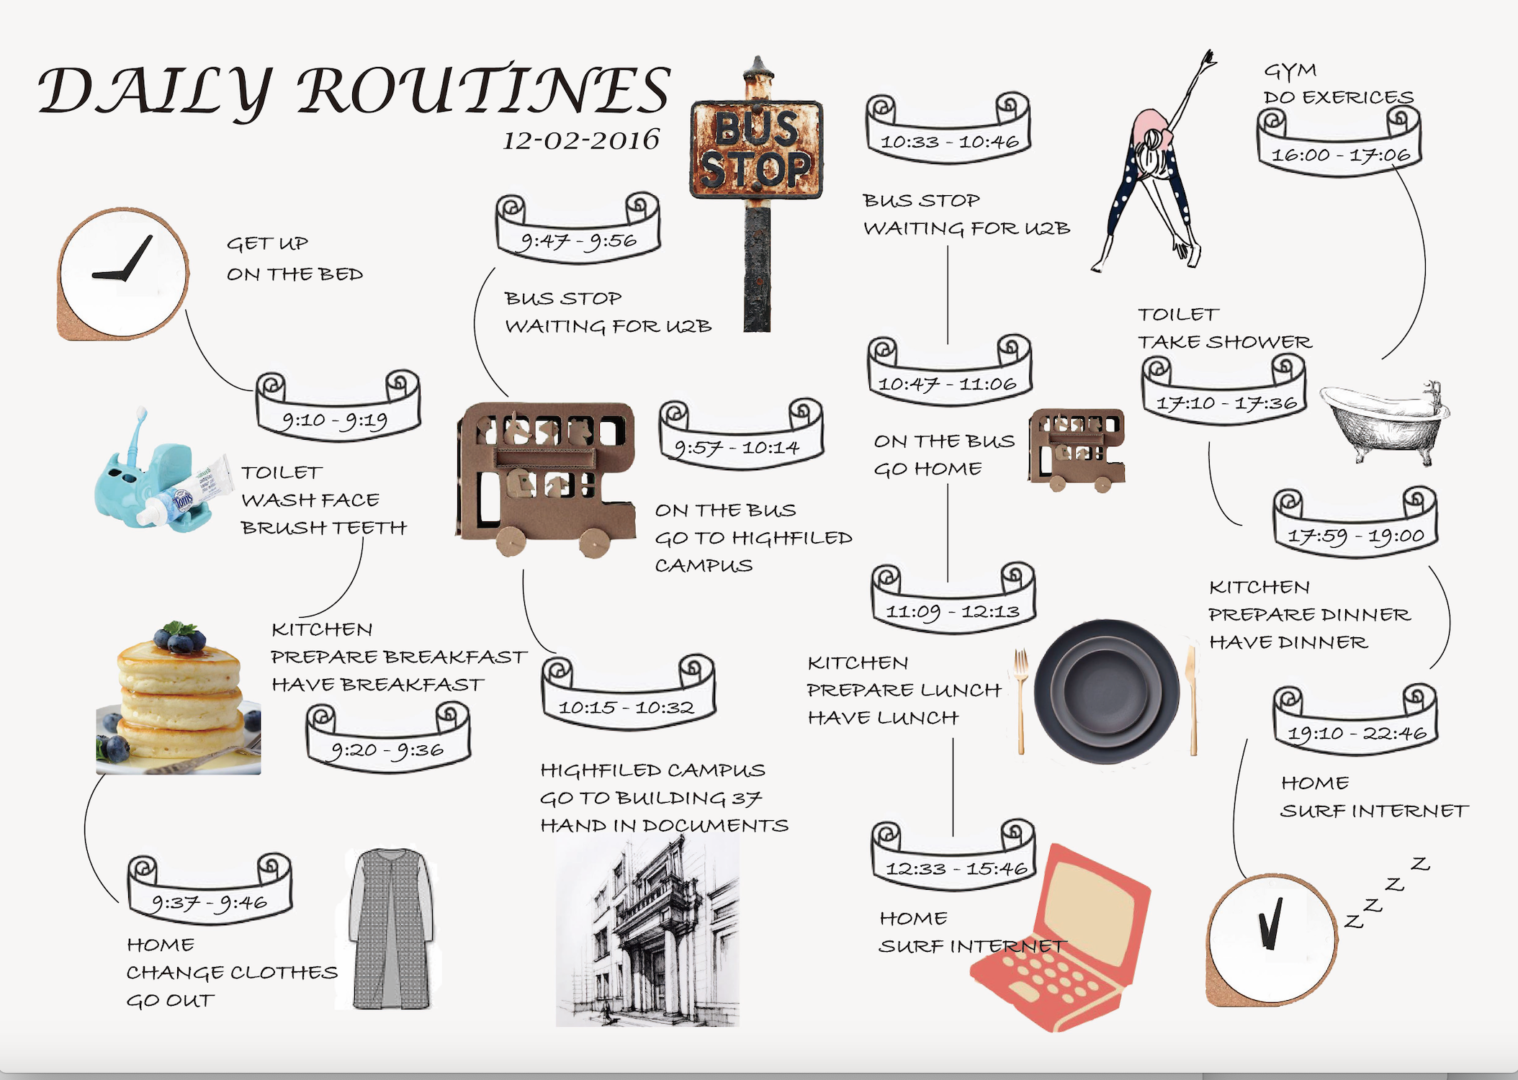
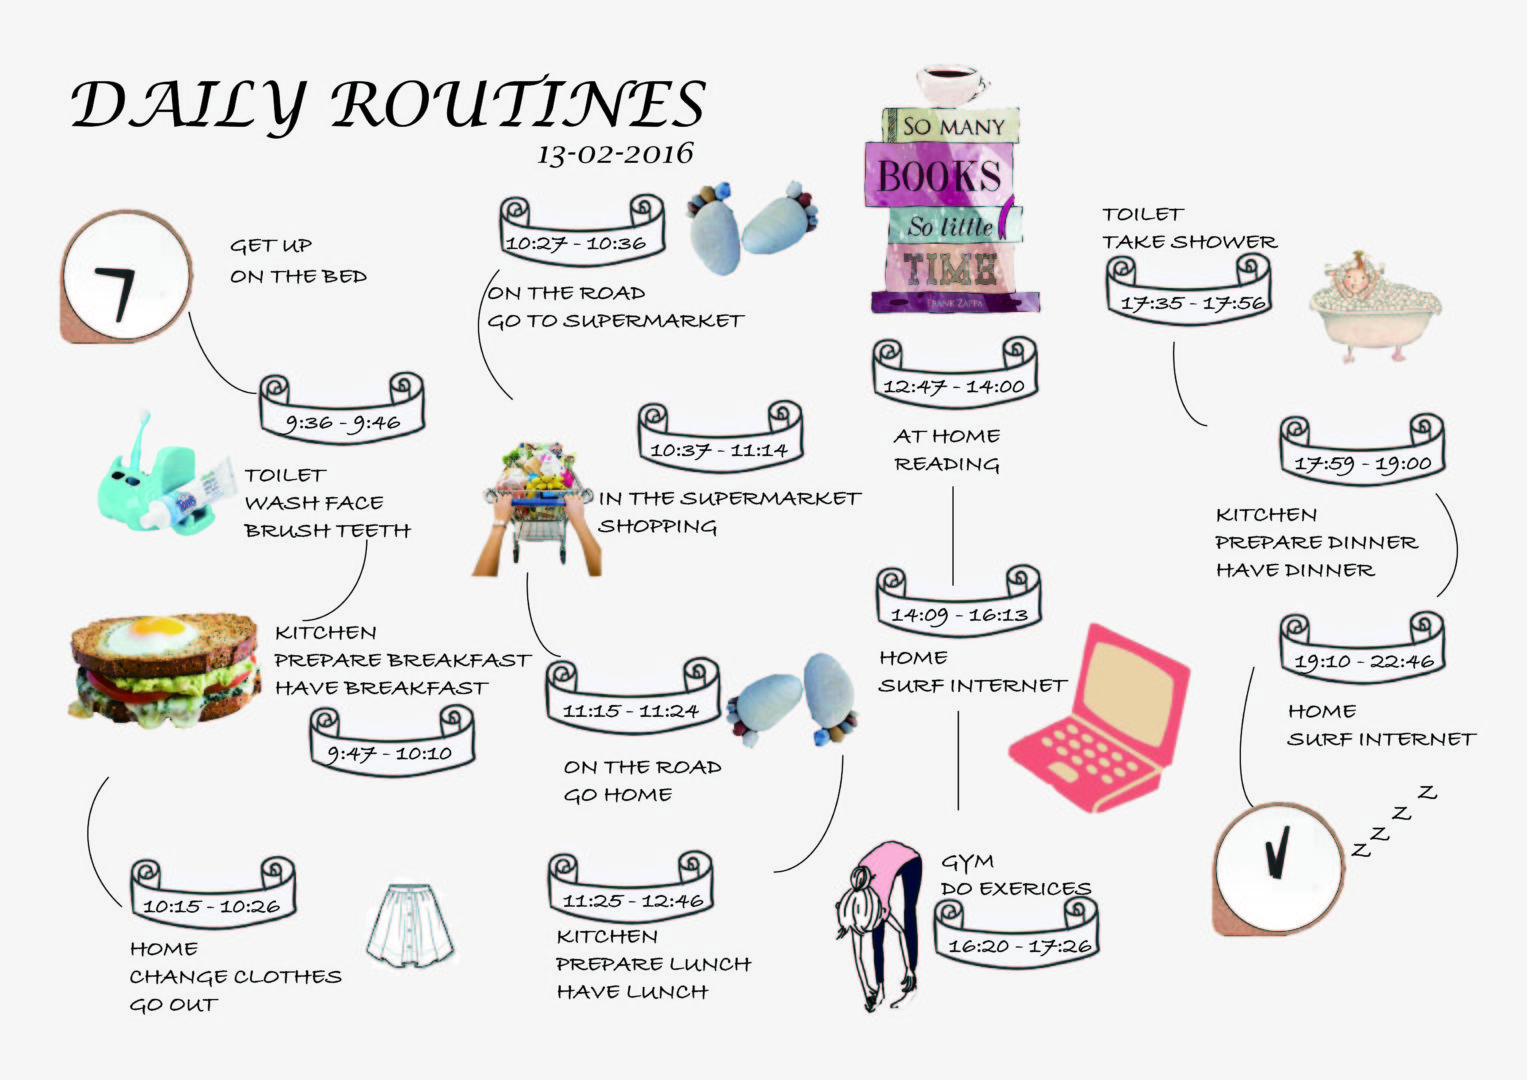
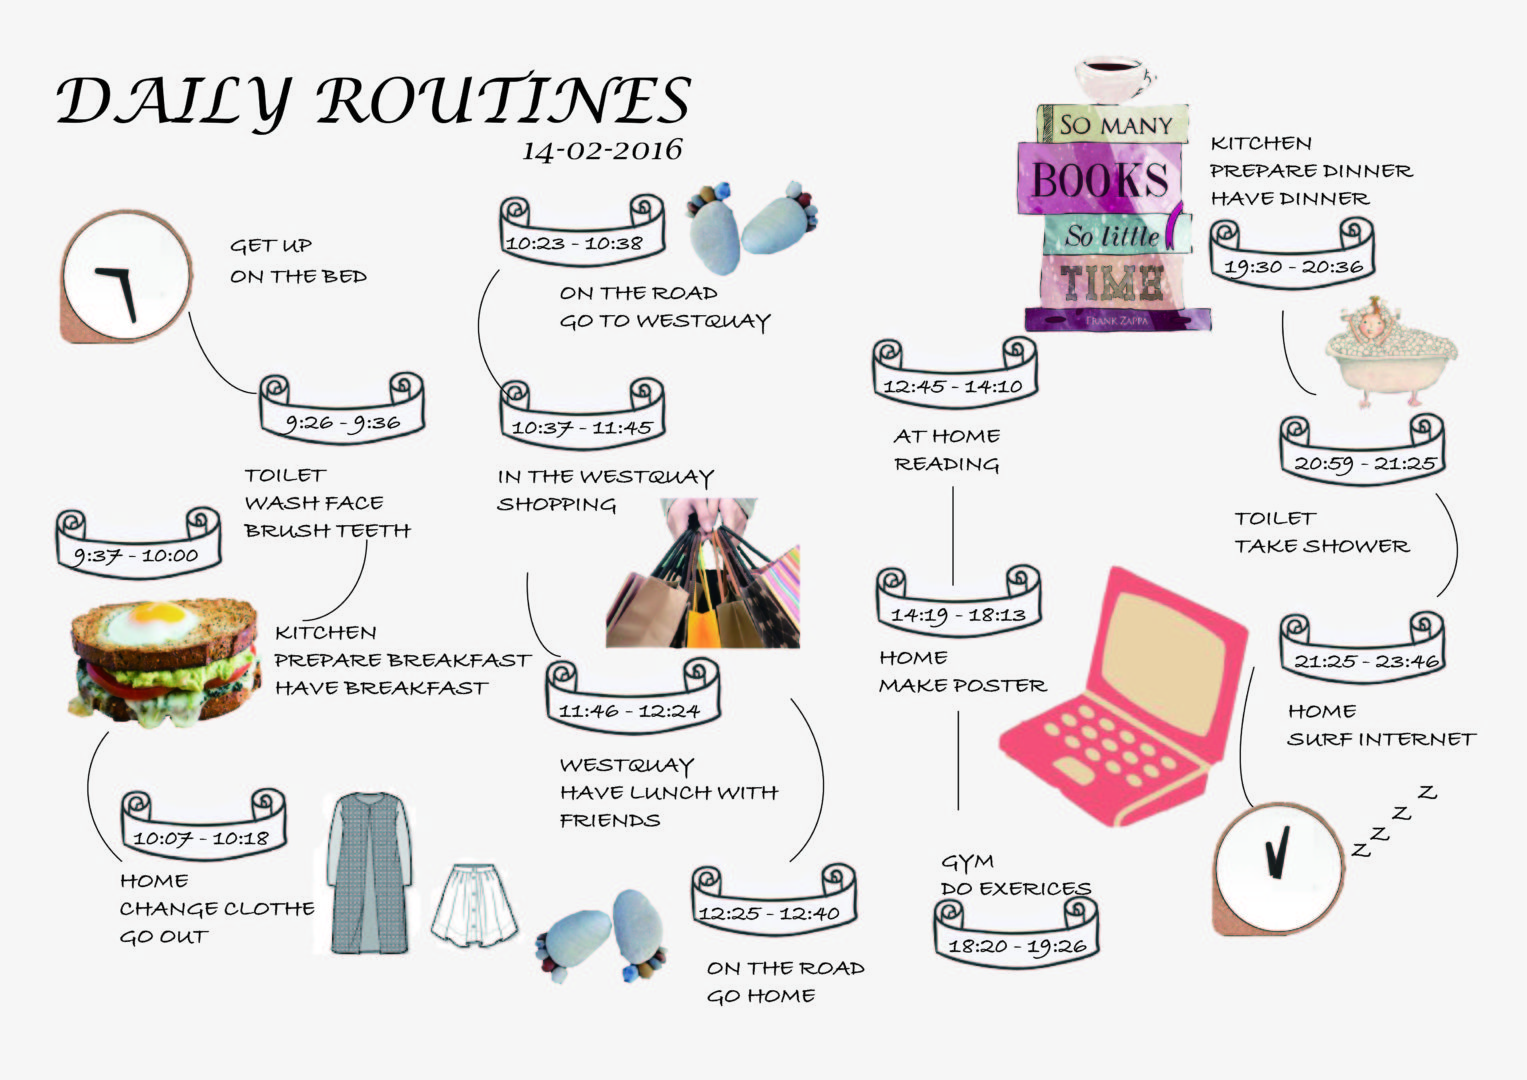
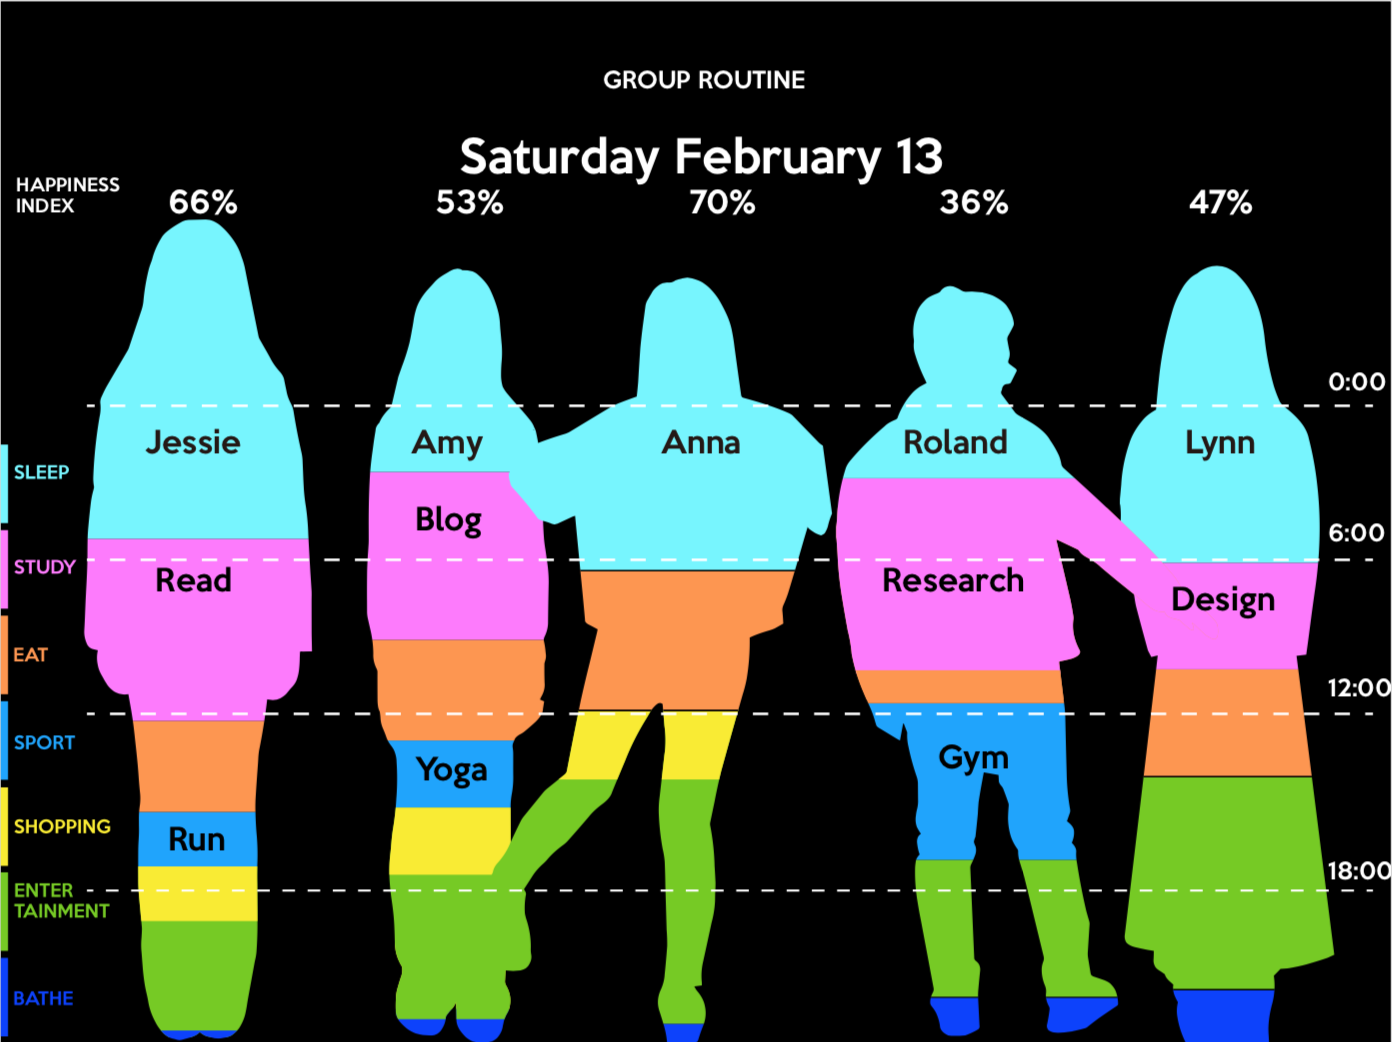
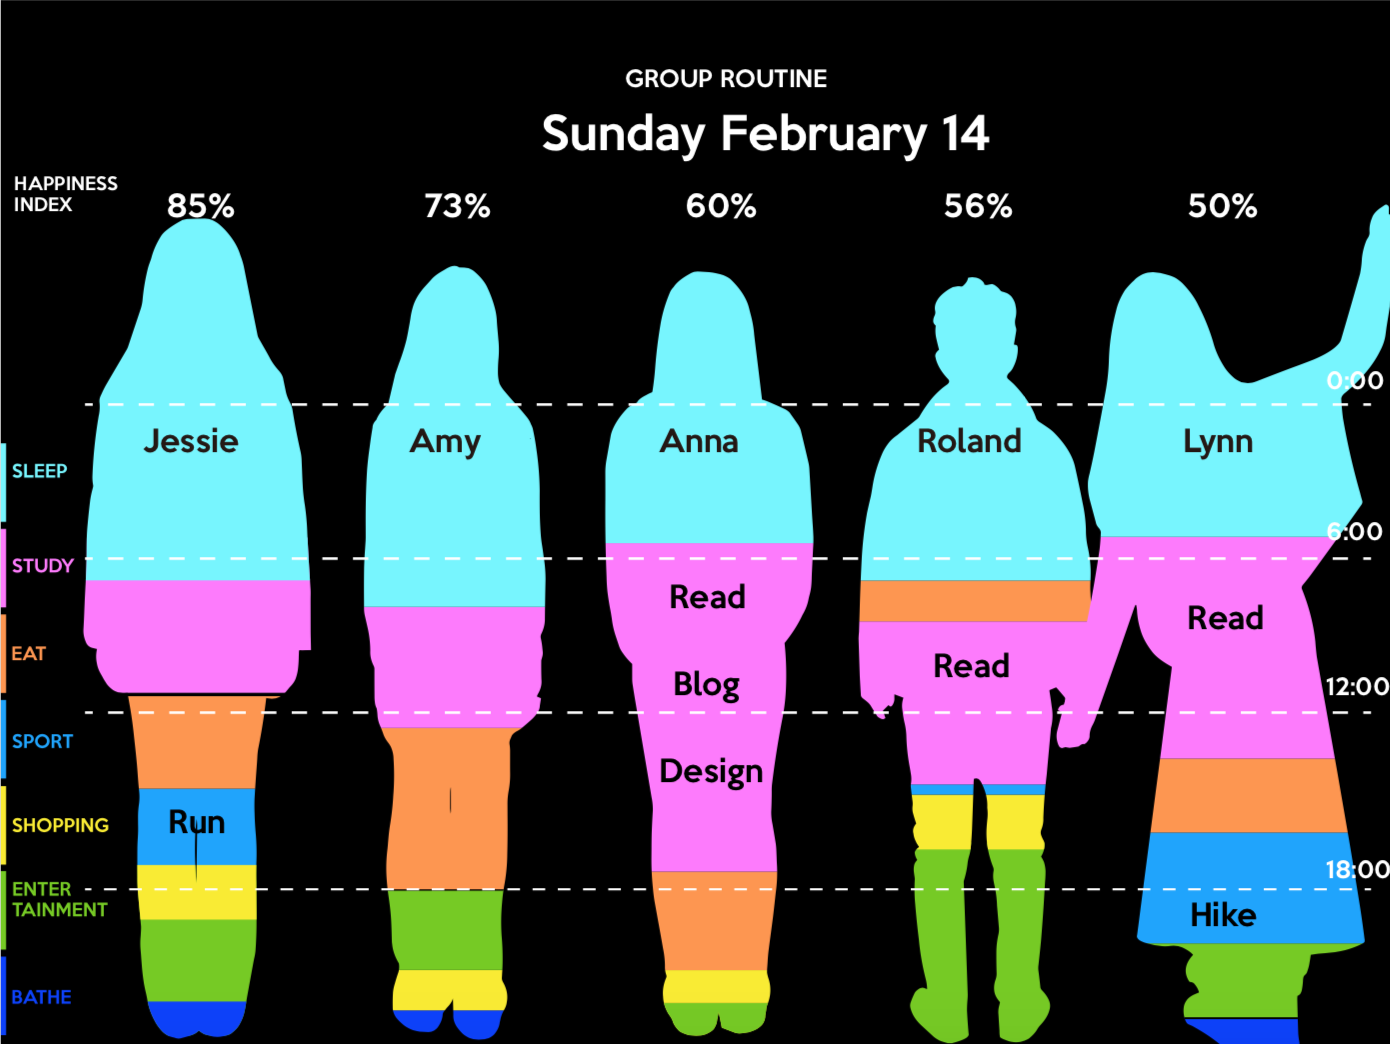
This is a team project, which I completed with my team members Anna, Roland, Lynn and Amy. We want to study the relationship between behavior and data representation: Add behavior performance (used to express emotions) to the projection display of data plots to more accurately represent the story behind the data. The data comes from the time arrangement statistics of daily life in three days. Here is my personal data record:
Design Process
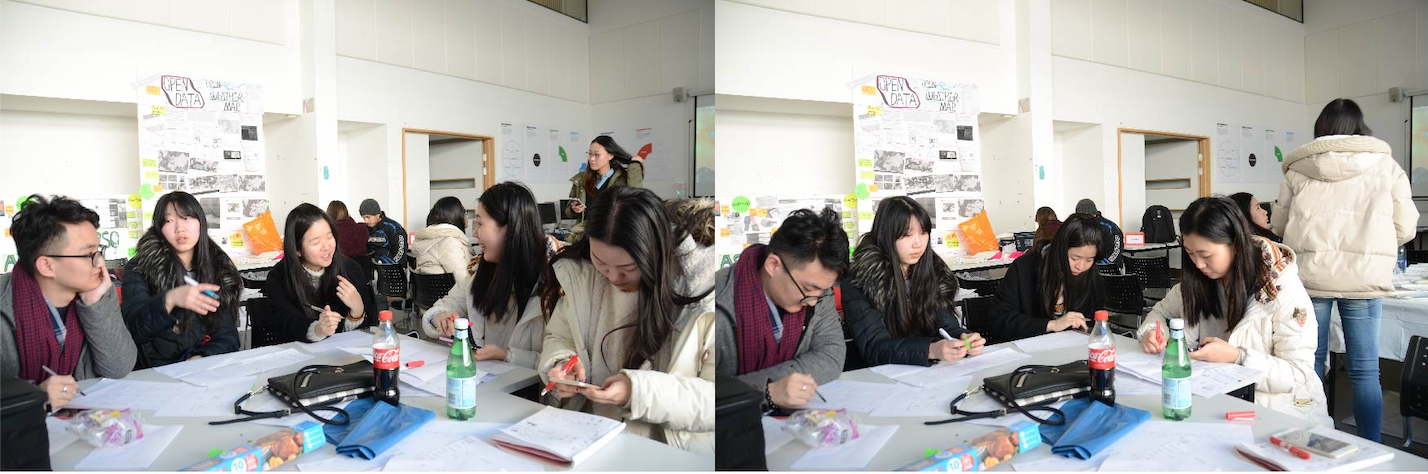
Scheme discussion
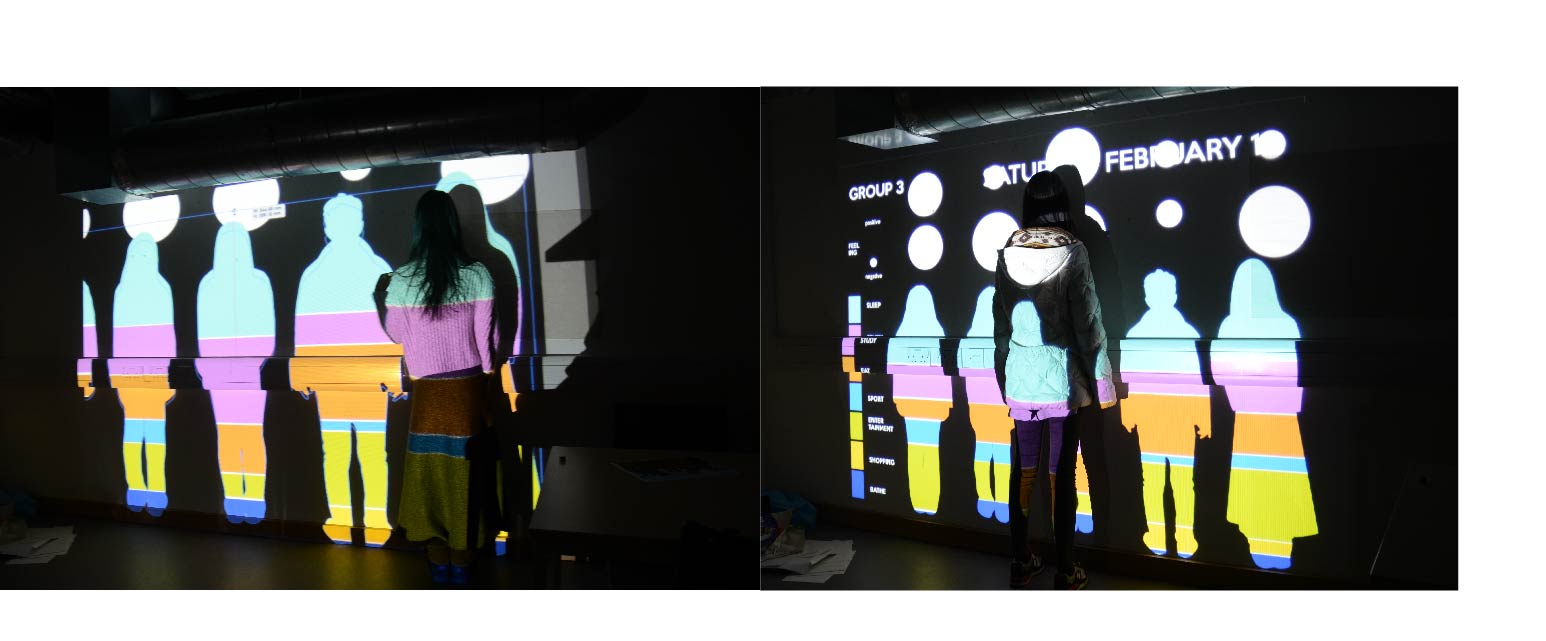
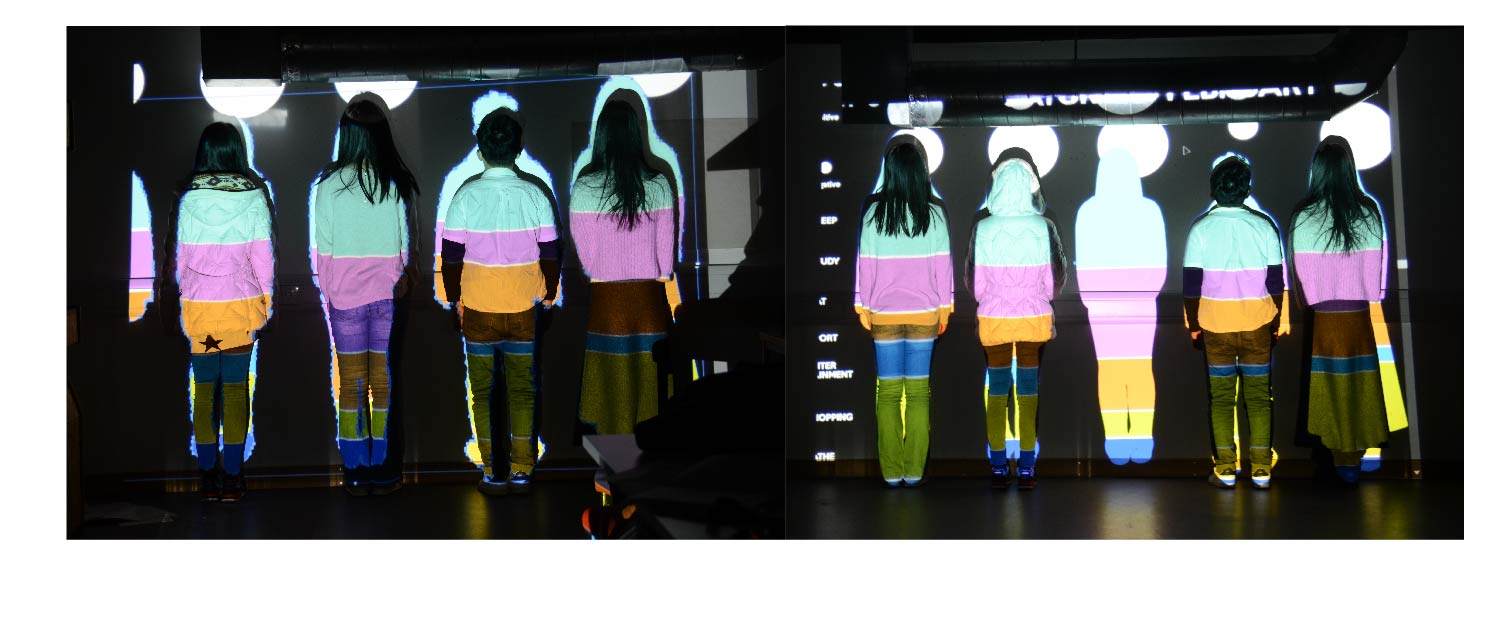
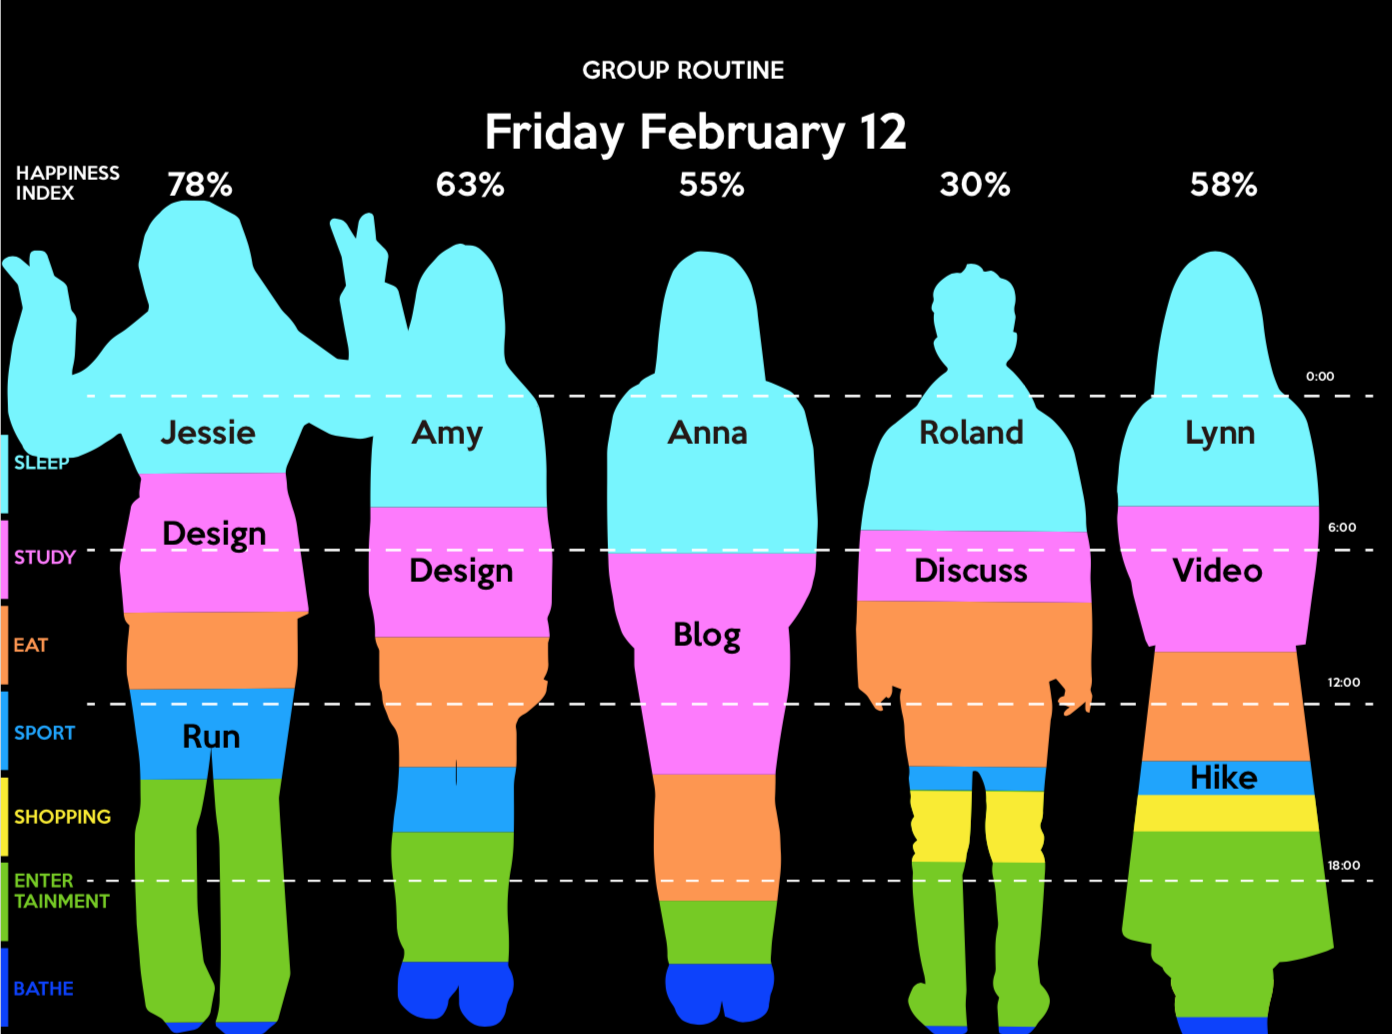
Determine the scheme: fill each person’s data in the corresponding person’s silhouette. The form of data visualization: Behavior performance with the charts projected on performer’s body.
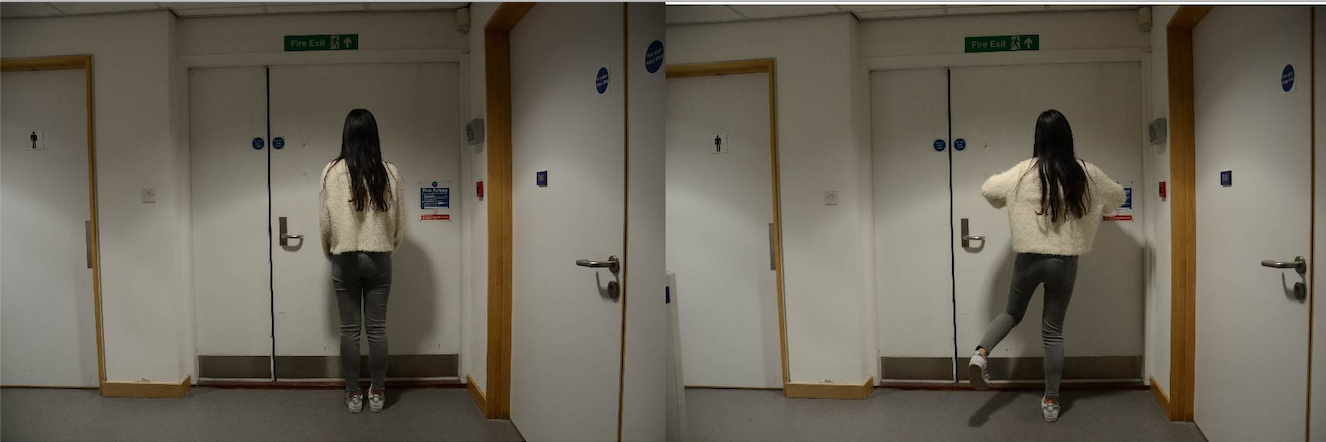
Silhouette shooting

Data presentation
Position adjustment